


Welcome back to another installment on Backheeled dot com of “J. Sam Jones does amateur Excel work and thinks he’s pretty smart”. The first, of course, being The MLS Entertainment Rankings, which I’ll probably have to revisit sometime soon. Before we get to the “math” on this one though, I want to explain what we’re doing here.
I don’t know how much crossover appeal there is for this outside of the southeast, but here in Atlanta we sometimes watch a thing called “American Collegiate Gridiron Football.” There’s an accompanying video game that they haven’t made since 2013 because the National Collegiate Athletic Association is the closest American equivalent to FIFA, but the game was simply called NCAA Football. It had a recurring feature entitled “Toughest Places to Play” wherein the game, with no explanation of criteria or process, ranked each college football stadium in the country by whatever “Toughest Places to Play” means.
It infuriated me.
I fired the game up again the other day and realized that MLS fans have never got to experience that same frustration. I want to do you a favor and deliver that to you now.
Except I’m far kinder than the folks at Electronic Arts. I’ve got a whole entire process here. And in the end you just might learn something before you become extremely mad online about your home stadium’s ranking.
METHODOLOGY (SORRY) ((AGAIN))
There’s some subjectiveness here of course. How else are we going to truly make this a “rankings” column? But first, let’s talk about the hard numbers.
The first factor is average attendance. It might seem simple, but the more people in the stands, the more imposing your stadium and atmosphere is. I took that average attendance number and moved it over a few decimal places to make my final number not be like 25,000.913 or something ridiculous.
The next factor is home win percentage. I care nothing for your draws. I want to know how often you’re getting all three points. In MLS, that’s generally pretty often. MLS, as you may know, has the largest home field advantage in the world.
For this formula, I took each team’s home winning percentage from the last five years and dropped the 2020 results because, well, duh. Essentially we have four years of data for most teams. Some teams either just built a new stadium or just entered the league, so we don’t have the same size data set. Some teams were in Canada in 2021 and had significant attendance reductions. I didn’t count that year for those teams either.
I also took a look at a team’s winning percentage at home relative to their away win percentage over the last five years (minus 2020). Some teams are just good. Some teams are far better at home. I think that distinction helps us get a better idea of which teams are actually gaining a pronounced “advantage” by being at home. I doubled this number because I thought it was a better indication of what we’re actually talking about here, while still being necessary to include overall home win %.
The last two components are a bit more subjective.
I gave an “outstanding circumstances” bonus of 0.25 to Colorado and NYCFC. Why? Because I’ve heard multiple players talk about just how miserable it can be to play at that altitude if you aren’t used to it and because it’s hard to hit a curveball both literally and metaphorically.
Then I did a bit of personal rankings. I watch a lot of MLS. To the point where I probably exceed my daily recommended amount. And in my time watching, I feel like I’ve gained a decent understanding of each crowd’s general vibe. So I did my best to put each stadium and its crowd into three “Rowdiness Tiers.” The top tier earned one point, the second tier earned 0.5 points and the bottom tier earned 0.25. Those points were awarded thusly:
Tier One: LOUD NOISES
Allianz Field, Banc of California Stadium, Bank of America Stadium, Children’s Mercy Park, Exploria Stadium, GEODIS Park, Lumen Field, Mercedes-Benz Stadium, Providence Park, Q2 Stadium, and TQL Stadium
Tier Two: When it’s on, it’s *on*
Subaru Park, Lower.Com Field, Audi Field, BMO Field, Dick’s Sporting Goods Park, Dignity Health Sports Park, Toyota Stadium, Yankee Stadium, Rio Tinto Stadium
Tier Three: Perhaps could be a little noisier. Maybe someone could crinkle tinfoil in the stands? I hear tinfoil can be quite loud.
Gillette Stadium, Red Bull Arena, Saputo Stadium, Soldier Field, PayPal Park, PNC Stadium
Now, you’re probably mad about some of those. Good. Do you feel it yet? Do you feel what 12 year old me felt seeing the University of Georgia’s Stadium ranked below Boise State’s because it’s blue or something? Well if you don’t feel it yet, I’m hoping you will soon. This is about community.
FINAL FORMULA
Anyway, the formula looks like this.
(Attendance/10000) + Home Win % since 2018 + (Home Win % since 2018 – Away Win % since 2018)2 + Rowdiness Coefficient = Toughest Places To Play Quotient
RANKINGS YOU SKIPPED TO (AGAIN)
Sorry to Bank of America Stadium in Charlotte and GEODIS Park in Nashville. You both don’t have enough data points yet. But congrats on being in Tier One of the “Rowdiness Tiers”.
Also in Tier One…
26. TQL STADIUM – FC CINCINNATI
Average Attendance: 20,871
Home Win %: 13.0
Away Win %: 28.0
YUP. Tier One rowdiness and still somehow at the bottom of the list. A truly impressive accomplishment. Cincy has a great fanbase, but I’m not sure the team has quite figured out that the people at TQL Stadium are cheering for them.
I know it’s only been open since May of last year, but that’s not going to stop me from judging FCC for being the only team on this list whose away win percentage is higher than their home win percentage. Goodness, Cincy. I need y’all to get it together. For the fans’ sake.
25. PAYPAL PARK – SAN JOSE EARTHQUAKES
Average Attendance: 13,132
Home Win %: 33.9
Away Win %: 17.2
The Quakes have a small but loyal fanbase whom I respect and appreciate dearly. And clearly, the Quakes are much better home. But I’m not sure anyone has ever worried too much about a trip to PayPal Park.
24. DRV PNK – INTER MIAMI
Average Attendance: 12,614
Home Win %: 44.0
Away Win %: 26.0
This is a fan base and city where a new stadium is going to work wonders. DRV PNK’s makeshiftness and Ft. Lauderdaleness doesn’t lend itself to atmospheres that are bursting with energy. The supporters’ section certainly throws a party though. If and when Inter Miami get their new home, that same energy is going to come across so much better. For now, they’re near the bottom of the list.
23. SUBARU PARK – PHILADELPHIA UNION
Average Attendance: 17,326
Home Win %: 38.6
Away Win %: 31.0
I’m not happy about this one. This one fails my eye test and my ear test. Philly messed themselves up being too good on the road. I tried to make other people mad and just ended up mad at myself. There’s a lesson here. I’m not gonna learn it. But there is one.
22. SOLDIER FIELD – CHICAGO FIRE
Average Attendance: 16,947
Home Win %: 34.8
Away Win %: 12.0
This home-away gap is hilarious because I have absolutely no idea why it exists. In my opinion Soldier Field is absolutely not tougher to play at than Subaru Park but I’m looking at the numbers and they’re telling me otherwise. The numbers are the numbers, y’all.
21. RED BULL ARENA – NEW YORK RED BULLS
Average Attendance: 14,915
Home Win %: 55.2
Away Win %: 39.0
I had to go back and check these numbers. Holy smokes. They’re right though. Remember, we’re going back to 2018 here and the Red Bulls set a points record that year. They’ve made the playoffs every year since. The Red Bulls are usually good at soccer and they don’t draw all that often.
But the Red Bulls being good doesn’t mean Red Bull Arena is tough on its own merits. New York got damaged by small attendance numbers and a generally low key atmosphere.
20. GILLETTE STADIUM – NEW ENGLAND REVOLUTION
Average Attendance: 18,446
Home Win %: 53.4
Away Win %: 29.3
It turns out that, like the Red Bulls, setting the MLS points record means you won a lot of home games. That being said, the Revs are another team whose atmosphere will pick up substantially if and when they get a stadium of their own. Their attendance numbers are never bad, but it’s just not fair to ask them to fill out Gillette game by game. It starts to feel kind of empty in there.
19. PNC STADIUM – HOUSTON DYNAMO
Average Attendance: 15,136
Home Win %: 45.8
Away Win %: 10.5
Ohmeohmy that away percentage. Houston catapulted themselves up this list just by being the worst team on the road by a significant margin over a five-year span. *That’s* how you game the system folks.
Anyway, hopefully attendance and the environment starts to pick up as folks in Houston realize that Hector Herrera is in town and that Dynamo front office seems a little more intent on putting together a quality product than past iterations.
18. SAPUTO STADIUM – CF MONTREAL
Average Attendance: 13,778
Home Win %: 57.5
Away Win %: 23.8
This is the first instance of a really strange trend where MLS teams simply don’t do well in Canada. I have no idea what would make it more difficult, but the Canadian teams all thrive at home. Maybe remembering your passport is more stressful than I thought?
I may not know what it is, but Montreal are excellent at home. And their percentage would probably be even better if they had a full season of normal home games last year.
17. DICK’S SPORTING GOODS PARK – COLORADO RAPIDS
Average Attendance: 13,864
Home Win %: 49.2
Away Win %: 22.8
So altitude helps a little, but maybe not all that much. I’m surprised to see how low the Rapids ended up, but a low attendance number and a subdued atmosphere will do that to you. Still, winning almost 50% of your home games isn’t bad.
16. DIGNITY HEALTH SPORTS PARK – LA GALAXY
Average Attendance: 24,325
Home Win %: 53.4
Away Win %: 31.0
The Galaxy crowds are some of the biggest in the league and generally seem pretty engaged.
They do pretty well at home. But not all that much better that it’s clear Dignity Health Sports Park is a fortress. Maybe Dignity Health Sports Park will become sentient and convince someone to start Dejan Joveljic? That would make it a tougher place to play.
15. TOYOTA STADIUM – FC DALLAS
Average Attendance: 15,834
Home Win %: 51.7
Away Win %: 22.4
Toyota Stadium has had some excellent crowds this season and they’ve earned their way to the middle of the pack here. This is one of the highest home-away gaps we had for a Rowdiness Tier Two stadium, But not quite as high as…
14. BC PLACE – VANCOUVER WHITECAPS
Average Attendance: 16,405
Home Win %: 63.4
Away Win %: 23.8
Vancouver…what. This is by far the largest home-away disparity we had for a Rowdiness Tier One stadium and the third highest of any stadium. I guess BC Place is secretly kind of a fortress? Maybe teams are distracted by the cool tarp things hanging from the top of the stadium? They do make some cool shadows. Again, being north of the border appears to be some kind of kryptonite for U.S.-based teams. I’m baffled but excited by it.
13. EXPLORIA STADIUM – ORLANDO CITY
Average Attendance: 17,499
Home Win %: 39.7
Away Win %: 22.4
One of the loudest crowds in MLS predictably ends up in the top half of the list. The Florida weather does them some favors as well. You would honestly expect both the home win % and the home-away gap to be larger though. It’s not as bad as Cincy, but the Lions need to do a better job of rewarding their fans.
12. AUDI FIELD – D.C. UNITED
Average Attendance: 16,382
Home Win %: 57.6
Away Win %: 19.6
I’m genuinely shocked here. I don’t know how this worked out but I have to assume D.C. being an actual swamp town plays a part. Whatever it is, that’s a major disparity between home and away win percentages. And I think it’s fair to say that D.C. fans do, in fact, show out when they’re given a product to get behind. It’s just…well, it’s been a while.
11. CHILDREN’S MERCY PARK – SPORTING KC
Average Attendance: 18,474
Home Win %: 49.2
Away Win %: 32.2
One of the standard bearers for stadium noise in MLS absolutely deserves being near the top ten. I’m a bit disappointed that SKC haven’t won more at home considering how. Freaking. Loud. it gets. When SKC are on, Children’s Mercy Park holds noise so well. It makes almost any game there worth turning on. Most years…
10. LOWER.COM FIELD – COLUMBUS CREW
Average Attendance: 18,751
Home Win %: 56.5
Away Win %: 16.7
One of the newer entries on this list, the Crew have sounded and looked pretty good at home since moving out of Mapfre.
They’re aided a lot, though, by Caleb Porter’s kind of hilariously bad away win percentage though. It’s honestly just impressive at this point.
9. Q2 STADIUM – AUSTIN FC
Average Attendance: 20,738
Home Win %:45.8
Away Win %: 20.8
If you’ve watched a game at Q2 Stadium at any point in its existence, you know why it’s in the top ten. It’s one of the best atmospheres in the league, aided by the best brass section in the league in La Murga, which contributes to a stadium full of green and brimming with energy. There aren’t many better stadiums or atmospheres in MLS.
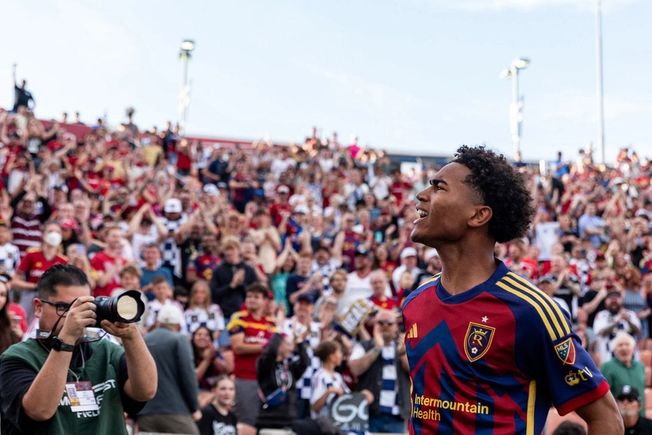
8. RIO TINTO STADIUM – REAL SALT LAKE
Average Attendance: 20,263
Home Win %: 64.9
Away Win %: 23.3
RSL DEVIL MAGIC WORKS BEST AT HOME.
I still can’t figure out why this year’s RSL team has earned so many points, but maybe I should have considered Rio Tinto as a major factor. They’ve had a whole handful of sellouts this year and they’ve simply been stellar at home over the course of the last five years. Away…not so much. It’s the second biggest gap on our list. There must be something special about…uh…Sandy, Utah.
7. BANC OF CALIFORNIA STADIUM – LOS ANGELES FC
Average Attendance: 22,043
Home Win %: 59.3
Away Win %: 40.4
The 3252 are my second favorite group of supporters to watch and listen to in the league. There’s a reason beyond the on-field product as to why LAFC home games produce some of the best events in MLS.
6. LUMEN FIELD – SEATTLE SOUNDERS
Average Attendance: 31,980
Home Win %: 57.9
Away Win %: 41.4
That away percentage is absurd – and damaging to Seattle’s case on this list, but encouraging to anyone feeling the need to make an argument that Seattle have easily been the best team in the league over the last five years. It’s the highest away win percentage in the league over that stretch. Seattle has sung “Jingle Bells” a lot lately.
They’ve also pulled out plenty of wins at home. No surprise there, with an excellent team and the second-largest attendance in the league.
5. ALLIANZ FIELD – MINNESOTA UNITED
Average Attendance: 19,337
Home Win %: 47.5
Away Win %: 19.3
The Loons have had ups and mostly downs since they joined the league, but Allianz Field has been one of the best in MLS from the jump. The post-win “Wonderwall” sing-a-long is one of the best traditions in MLS and the crowd is constantly pretty raucous, or at least eager to spin their scarves over their heads. Minnesota does it right.
4. BMO FIELD – TORONTO FC
Average Attendance: 23,268
Home Win %: 61.0
Away Win %: 14.6
Folks, I present to you the single largest gap between a home and away win percentage in the league and yet another piece of evidence for my new theory that nothing is more draining for an MLS player on a U.S.-based team than crossing the border to Canada. Seriously, that gap is absurd. And I’m genuinely stunned Toronto have been that bad on the road.
That being said, BMO Field will be expanding soon and I can imagine that Toronto will be able to fill those extra seats consistently. When Toronto are good (and they’re usually relatively good excluding last season….and this season….and 2018), BMO Field can become one of the rowdiest venues in the league very quickly.
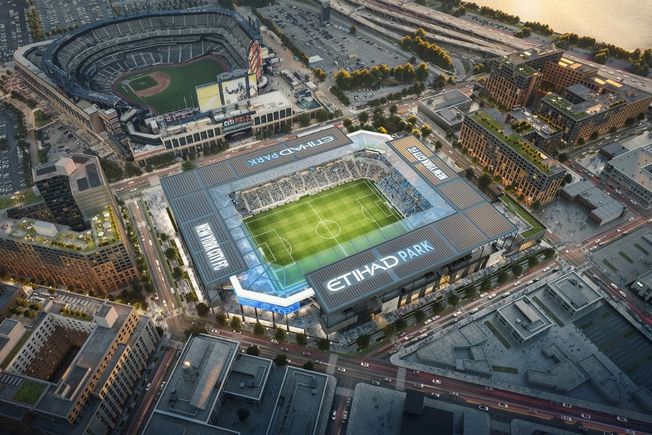
3. YANKEE STADIUM – NEW YORK CITY FC
Average Attendance: 17,383
Home Win %: 66.1
Away Win %: 30.4
NYCFC’s home win percentage is the highest in the league over the last five years. That’s not surprising considering the Yankee Stadium of it all and the fact that NYCFC have collected a ton of points in that time. I know they need a new stadium and the atmosphere will probably improve tenfold when they get it, but the advantage is real. And that will go away whenever they move into someplace a little more soccer appropriate.
It’s almost a bummer that a move away looks increasingly possible.
2. PROVIDENCE PARK – PORTLAND TIMBERS
Average Attendance: 23,384
Home Win %: 55.2
Away Win %: 28.8
Crazy loud with an incredible supporters’ section that seems to swallow their end of the stadium.
It doesn’t look that big from the normal game view, but then they cut to a head on shot of that end of the field and you realize that it’s a mass of bodies that runs deep and wide. It’s a blast to watch and I’m desperate for the day where the Timbers don’t play some of the most stagnant soccer in the league. Providence Park would go up another level. And it’s already a madhouse.
For my money, no other stadium is worth tuning in for in quite the same way.
1. MERCEDES-BENZ STADIUM – ATLANTA UNITED
Average Attendance: 46,239
Home Win %: 60.3
Away Win %: 36.8
I almost felt bad about it. But then I remembered two things:
- The latest anonymous player poll from the MLSPA had the players picking MBS as the winner.
- I am here to make you feel what I felt when I was a kid. And that’s intense anger at who and how the Toughest Place to Play was picked. You’re welcome.

Comments